 Chetan Velhal
API performance testing using JMETER

In this article we are going to learn about How to use step by step JMETER for API Load and Performance testing . Basic information and details about JMETER and what is web service and API had been provided in our earlier topics. JMETER is open source tool. Downloading JMETER is already covered in earlier topic. JMETER is free.
For question How to do API performance testing using JMETER? below are the steps.
Step 1. Configure Test Plan in JMETER
For REST API performance testing we have to start with Test plan in JMETER. The test Plan is where the overall settings for a test are specified. Static variables can be defined for values that are repeated throughout a test, such as server names. For example the variable “environment” could be defined as www.example.com, and the rest of the test plan could refer to it as ${environment}. This simplifies changing the name later

Step2. Adding HTTP Header manager to JMETER
- Right click on test plan >Add> Config element> http header manager
- Click on Add button to add header

Step3. Adding Thread group to JMETER
Right click on Test Plan> Click Add> Click Threads>Thread group

You can see thread group is added in project.
A Thread Group defines a pool of users that will execute a particular test case against your server.
Number of Threads-Number of users to simulate
Ramp-up Period-How long JMeter should take to get a
Loop Count-Number of times to perform the test case.

Step4. Adding HTTP Requests
1.Right click on thread group> Samplers> HTTP Request

2. HTTP Request added to project. This sampler lets you send an HTTP/HTTPS request to a web server.
3. Use Protocol- HTTPS, Server name- Endpoint URL of API, Method , Enter REST request in BODY DATA tab and Save

Step 5-5. Adding Listener’s
Most of the listeners perform several roles in addition to "listening" to the test results. They also provide means to view, save, and read saved test results. We are using two listeners “Summary Report” and “View result Tree”. Right click on Thread group> Add> listeners

“Summary Report” and “View result tree” both listeners are added to project
6. Running Test
a. Click on test plan and update
Number of Threads (5)
Ramp-up Period(0)
Loop Count(1)
And click on run button

b. Once you start execution you can see Number of users Test run, Time in upper right corner. Once execution done Green flag turn down to Grey

7. Understanding JMETER performance testing Reports
A- How to understand JMETER Summary Report

Label - The name of the sample.
# Samples - The number of samples with the same label
Average - The average elapsed time of a set of results
Min - The lowest elapsed time for the samples with the same label
Max - The longest elapsed time for the samples with the same label
Std. Dev. - the Standard Deviation of the sample elapsed time
Error % - Percent of requests with errors
Throughput - the Throughput is measured in requests per second/minute/hour. The time unit is chosen so that the displayed rate is at least 1.0. When the throughput is saved to a CSV file, it is expressed in requests/second, i.e. 30.0 requests/minute is saved as 0.5.
Received KB/sec - The throughput measured in Kilobytes per second
Sent KB/sec - The throughput measured in Kilobytes per second
Avg. Bytes - average size of the sample response in bytes
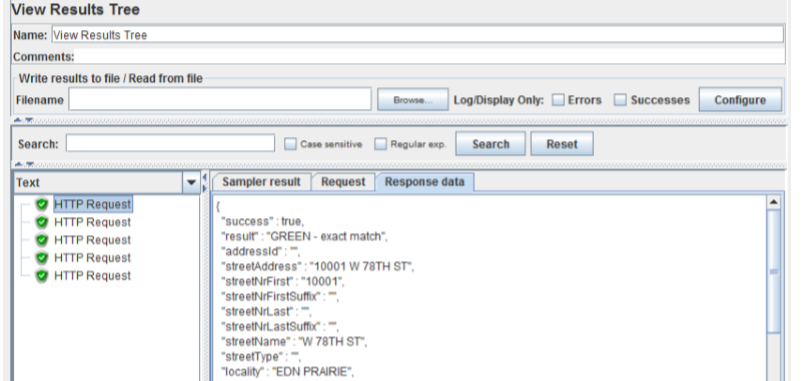
b. Understanding JMTER View Result Tree Report –
Sampler Result Tab- Here you can see 5 HTTP Request in Green as we done Performance test with 5 users and all were succeeded. If any one or more failed it will show in Read. Here you can header data passed for each user

Request Tab- You can see here Request sent for each user

Response Data Tab- You can see here response received for each user

0 comments:
Post a Comment