Thursday, December 27, 2018

 API performance testing using JMETER


In this article we are going to learn about How to use step by step JMETER for API Load and Performance testing . Basic information and details about JMETER and what is web service and API had been provided in our earlier topics.  JMETER is open source tool. Downloading JMETER is already covered in earlier topic. JMETER is free.


For question How to do API performance testing using JMETER? below are the steps.

Step 1.  Configure Test Plan in JMETER

For REST API performance testing we have to start with Test plan in JMETER. The test Plan is where the overall settings for a test are specified. Static variables can be defined for values that are repeated throughout a test, such as server names. For example the variable “environment” could be defined as www.example.com, and the rest of the test plan could refer to it as ${environment}. This simplifies changing the name later


Step2. Adding HTTP Header manager to JMETER
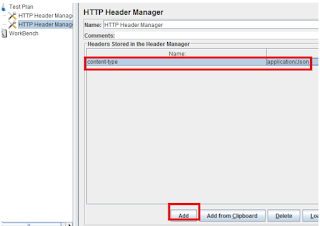
  1.     Right click on test plan >Add> Config element> http header manager
  2.     Click on Add button to add header 

There are multiple headers are available you can use any as per your requirement

Step3. Adding Thread group to JMETER
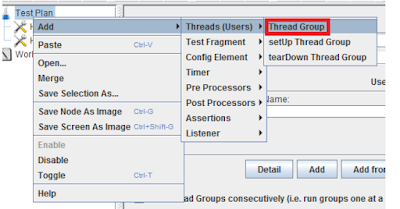
 Right click on Test Plan> Click Add> Click Threads>Thread group


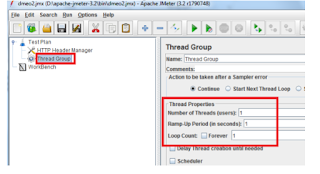
You can see thread group is added in project.
A Thread Group defines a pool of users that will execute a particular test case against your server.
Number of Threads-Number of users to simulate
Ramp-up Period-How long JMeter should take to get a
Loop Count-Number of times to perform the test case.


Step4. Adding HTTP Requests
 1.Right click on thread group> Samplers> HTTP Request 


2. HTTP Request added to project. This sampler lets you send an HTTP/HTTPS request to a web server.
3. Use Protocol- HTTPS, Server name- Endpoint URL of API, Method , Enter REST request in BODY DATA tab and Save

Step 5-5. Adding Listener’s 

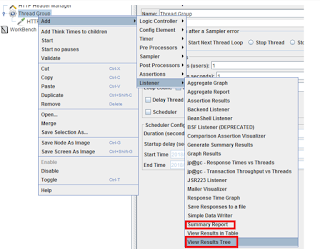
Most of the listeners perform several roles in addition to "listening" to the test results. They also provide means to view, save, and read saved test results. We are using two listeners  “Summary Report” and “View result Tree”. Right click on Thread group> Add> listeners 


 “Summary Report” and “View result tree” both listeners are added to project  

6. Running Test 

a.  Click on test plan and update 
  Number of Threads (5)
  Ramp-up Period(0)
  Loop Count(1) 
And click on run button  

b. Once you start execution you can see Number of users Test run, Time in upper right corner. Once execution done Green flag turn down to Grey 

7. Understanding  JMETER performance testing Reports 

A- How to understand JMETER Summary Report 


 Label - The name of the sample.  
 # Samples - The number of samples with the same label 
 Average - The average elapsed time of a set of results
  Min - The lowest elapsed time for the samples with the same label 
Max - The longest elapsed time for the samples with the same label 
Std. Dev. - the Standard Deviation of the sample elapsed time 
Error % - Percent of requests with errors 
Throughput - the Throughput is measured in requests per second/minute/hour. The time unit is chosen so that the displayed rate is at least 1.0. When the throughput is saved to a CSV file, it is expressed in requests/second, i.e. 30.0 requests/minute is saved as 0.5. 
Received KB/sec - The throughput measured in Kilobytes per second 
Sent KB/sec - The throughput measured in Kilobytes per second
  Avg. Bytes - average size of the sample response in bytes 

b.  Understanding JMTER View Result Tree Report –  
Sampler Result Tab-  Here you can see 5 HTTP Request in Green as we done Performance test with 5 users and all were  succeeded. If any one or more failed it will show in Read. Here you can  header data passed for each user


Request Tab- You can see here Request sent for each user

Response Data Tab- You can see here response received for each user 


Thursday, December 20, 2018


Understanding Listeners in JEMTER  :-  Listener displays particulars of sampler requests and responses, and can display basic HTML and XML representations of the response. Other listeners deliver summary or aggregation information. We can use listeners can direct the data to a file for later use. Listeners can be added anywhere in the test, including directly under the test plan

Types of JMETER Listeners 

1.                Aggregate Graph
The Aggregate Graph listener is used to show the test results in both tabular form(reports) and graphs.
2.                Aggregate Report
The Aggregate Report listener is used to display and store test results in the form of reports.
3.                Assertion Results
The assertion results listener is used to display the assertion result for each erroneous sampler response. It is advised to not use this listener during performance test as it is very resource intensive. It should be used while debugging and functional testing only.
4.                Backend Listener
The backend listener is a special type of asynchronous listener used specifically with BackendListenerClient for its customization.
5.                BeanShell Listener
The beanshell listener is used to enable beanshell scripting in JMeter. For details on BeanShell Scipting check our tutorial Bean Shell Scripting in JMeter.
6.                BSF Listener
The beanshell listener is used to enable BSF scripting in JMeter.
7.                Comparison Assertion Visualizer
The Comparison Assertion Visualizer is used to provide the comparison between assertion result in an easy to compare UI.
8.                Generate Summary Results
The Generate Summary results listener is used to store and display detailed test results to log files.
9.                Graph Results
The Graph results listener is used to display each sampler resuest's response time graph in terms of average, median, deviation and throughput.
10.             JSR223 Listener
The JSR223 Listener is used to enable JSR223 scripting in JMeter.
11.             Mailer Visualizer
The Mailer Visualizer sampler is used to provide the functionality of sending customized mails in case of some specific error threshold.
12.             Monitor Results
This is a newly added listener in JMeter used to display and store server performance stats.
13.             Response Time Graph
The response time graph is used to provide the graphical representation of response time with time elapsed during the test run.
14.             Save Response to a file
The save response to a file listener is used to store the sampler response in a file. This listener is used while functional testing or debugging the test script.
15.             Simple Data Writer
The simple data writer listener is used to save the sampler response to a file after with different configurations to remove several unnecessary overheads.
16.             Summary Report
The summary report is used to store and display the test result in tabular form just like aggregate report listener but consumes less memory(as per Apache JMeter).
17.             View Results Tree
This listener is used to provide and store test results for each and every individual sampler.
18.             View Results in Table
The view results in table listener is used to display the sampler response header and response body.


Tuesday, December 11, 2018


In this part of step by step JMETER tutorial we are going to learn about JMETER element “THREAD GROUP”

What is Thread Group in JMETER:-

Thread group is a place where we actually put number of users (Threads). It is starting point of JMETER test plan. This is first element of JMETER test plan. Each thread represent one user.  Using this Thread Group you can set number of users. Using thread group is basic step to start with JMETER load testing.

Now let’s understand How Element Thread group works .
If you put load of 50 users on your server by configuring 50 threads . Then all 50 user will simulate and will put load on server.


There are 3 controls we need to set for JMETER
  • Set the number of threads
  • Set the ramp-up period
  • Set the number of times to execute the test

  • How to set the number of threads
Here we need to set number of threads . If you put load of 50 users on your server by configuring 50 threads . Then all 50 user will simulate and will put load on server.
  • How to set the ramp-up period
The ramp-up period expresses JMeter how long to take to "ramp-up" to the full number of threads selected. If 10 threads are used, and the ramp-up period is 100 seconds, then JMeter will take 100 seconds to get all 10 threads up and running
  • How to set the number of times to execute the test (LOOP count):- how many times to run thread group  in loop. If you set value 2 then thread group will run twice.

Popular Posts